HFCL Share Price Target 2026, 2027, 2028, 2030: Complete Investment Analysis
HFCL Share Price Target
Can HFCL Be a Multibagger? Is HFCL a Good Company to Invest In?
HFCL Limited stands as one of India’s most prominent telecom infrastructure companies, operating at the intersection of optical fiber cables, telecom equipment, and defence electronics. As India pushes forward with its digital transformation and defence indigenization initiatives, investors are increasingly asking whether HFCL can deliver multibagger returns and whether it represents a sound long-term investment opportunity.
This comprehensive analysis examines HFCL share price targets for 2026, 2027, 2028, and 2030 while evaluating the company’s fundamentals, growth catalysts, risks, and investment potential. The analysis draws from the latest financial results, management commentary, and market data available as of early 2026.
Table of Contents
Understanding HFCL Limited: Company Overview
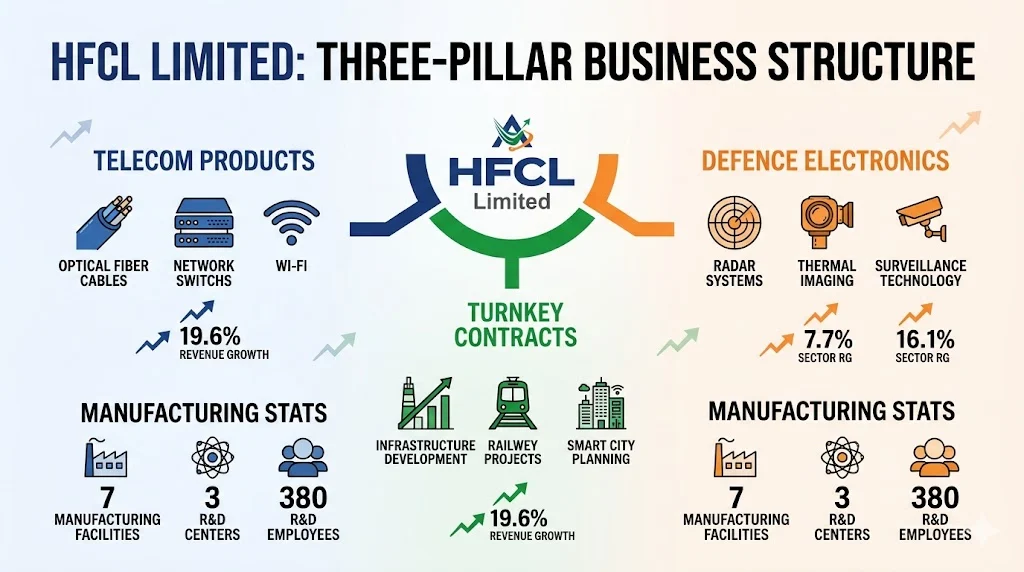
HFCL Limited operates as a diversified technology company with three core business segments that position it strategically within India’s growing digital infrastructure ecosystem.
Core Business Operations
The company maintains a diversified portfolio across multiple high-growth sectors:
Telecom Products Segment: This division manufactures optical fiber cables, optical fiber, and various telecom equipment including ethernet switches, radios, Wi-Fi access points, and cloud-based network management systems. The segment serves as the company’s revenue backbone and benefits directly from India’s expanding digital infrastructure requirements.
Turnkey Contracts and Services Segment: HFCL delivers comprehensive telecom infrastructure and communication network systems for telecom operators, defence services, railways, and smart city projects. This segment provides stable revenue streams through long-term contracts.
Defence Electronics Segment: The company’s newest growth vertical focuses on defence communication systems, surveillance technologies, thermal imaging systems, and radar technologies. This segment aligns with India’s Atmanirbhar Bharat mission and offers higher margin potential compared to traditional telecom products.
Manufacturing and R&D Infrastructure
HFCL operates seven manufacturing facilities across India supported by three state-of-the-art research and development centers located in Bengaluru, Hyderabad, and Gurugram. The R&D team comprises approximately 380 employees, representing roughly 10% of the company’s total workforce of 3,547 employees as of FY24.
The company has demonstrated significant commitment to innovation, nearly tripling its R&D expenditure from ₹89 crore in FY22 to ₹233 crore in FY24. This investment represents 5.72% of total turnover in FY24, up from 2.06% in FY22, indicating management’s focus on developing proprietary technologies and reducing dependence on imported solutions.
HFCL Share Price Target 2026: Recovery and Expansion Phase
The year 2026 represents a critical inflection point for HFCL as the company executes its ambitious expansion plans while recovering from profitability challenges experienced in 2025.
Monthly Share Price Targets for 2026
Based on technical analysis, fundamental projections, and management guidance, here are the detailed monthly price targets for HFCL in 2026:
| Month | Minimum Price Target (₹) | Maximum Price Target (₹) | Key Catalysts |
|---|---|---|---|
| January 2026 | 131 | 140 | Q3 FY26 results impact, export order momentum |
| February 2026 | 136 | 147 | Defence subsidiary operationalization |
| March 2026 | 141 | 153 | Preform facility approval, FY26 close |
| April 2026 | 138 | 158 | Q4 FY26 earnings anticipation |
| May 2026 | 145 | 165 | Capacity expansion progress updates |
| June 2026 | 152 | 172 | OFC capacity reaching 42.36 million fkm milestone |
| July 2026 | 158 | 178 | Monsoon season impact, order book updates |
| August 2026 | 165 | 185 | Defence export pipeline execution |
| September 2026 | 172 | 192 | H1 FY27 results, festival season demand |
| October 2026 | 178 | 198 | Q2 FY27 earnings, global OFC demand trends |
| November 2026 | 185 | 205 | Annual guidance for FY27, investor presentations |
| December 2026 | 195 | 220 | Year-end portfolio rebalancing, 2027 outlook |
Description of the 2026 Price Target Table:
The table above presents a comprehensive month-by-month projection for HFCL’s share price movement throughout 2026. The minimum price targets represent conservative scenarios where the company meets basic expectations but faces execution challenges or market headwinds. The maximum price targets reflect optimistic scenarios where expansion plans proceed smoothly, export orders materialize as planned, and broader market sentiment remains positive.
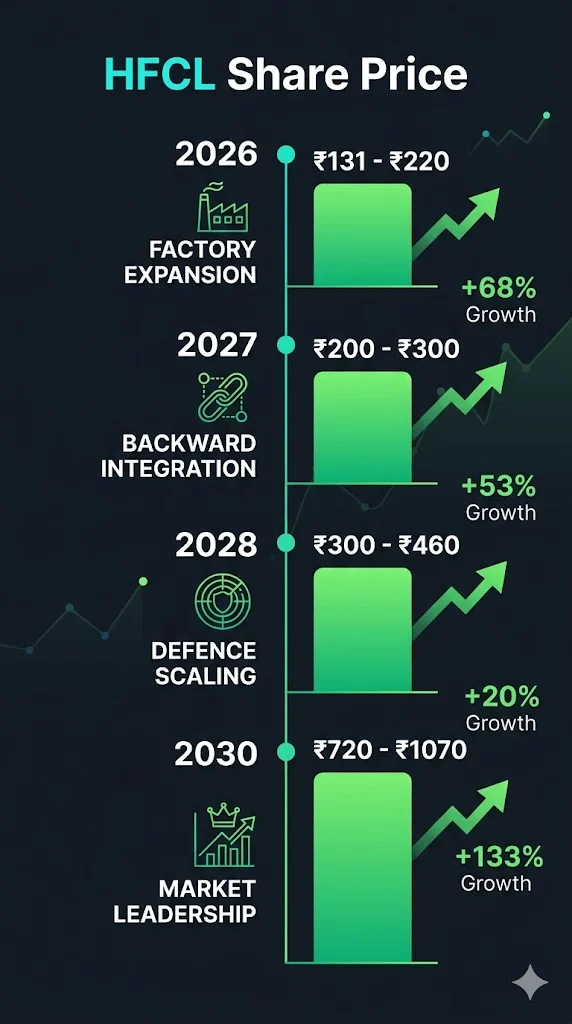
The progression from January to December shows an expected upward trajectory, with the minimum target rising from ₹131 to ₹195 (representing 49% upside from the starting point) and the maximum target expanding from ₹140 to ₹220 (representing 57% upside). This gradual appreciation reflects the market’s expected recognition of HFCL’s improving fundamentals as capacity expansions come online and defence orders begin contributing meaningfully to revenues.
Key Growth Drivers for 2026
Several specific factors support the 2026 price targets:
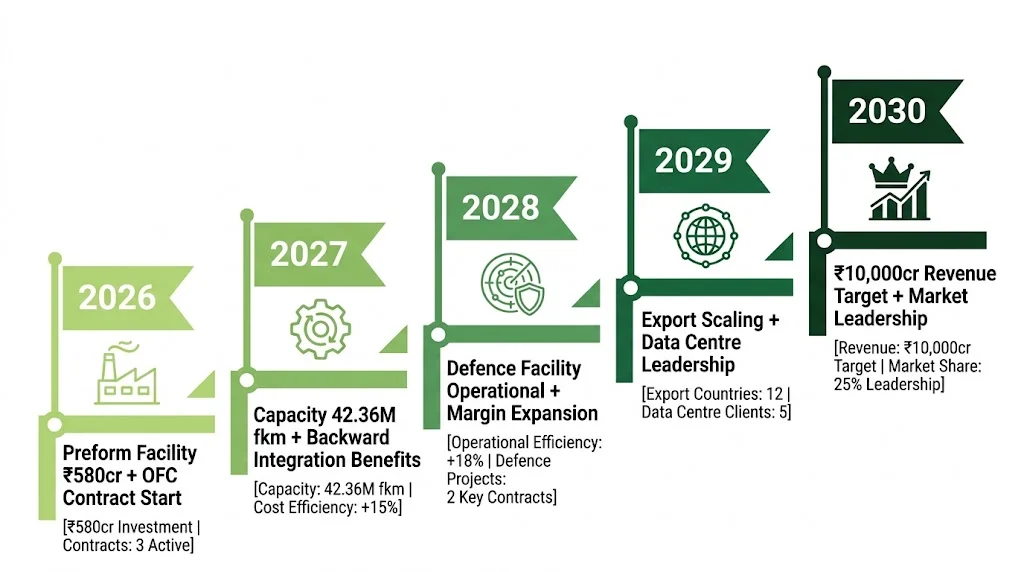
Capacity Expansion Execution: HFCL has approved a ₹580 crore preform manufacturing facility that will enable backward integration in optical fiber production. This facility reduces import dependency and improves margin profiles. Additionally, the company plans ₹800 to ₹900 crore in capital expenditure funded through promoter equity to expand fiber and defence segments. Optical fiber capacity is scheduled to increase from 30.5 million fiber kilometers to 42.36 million fiber kilometers by June 2026.
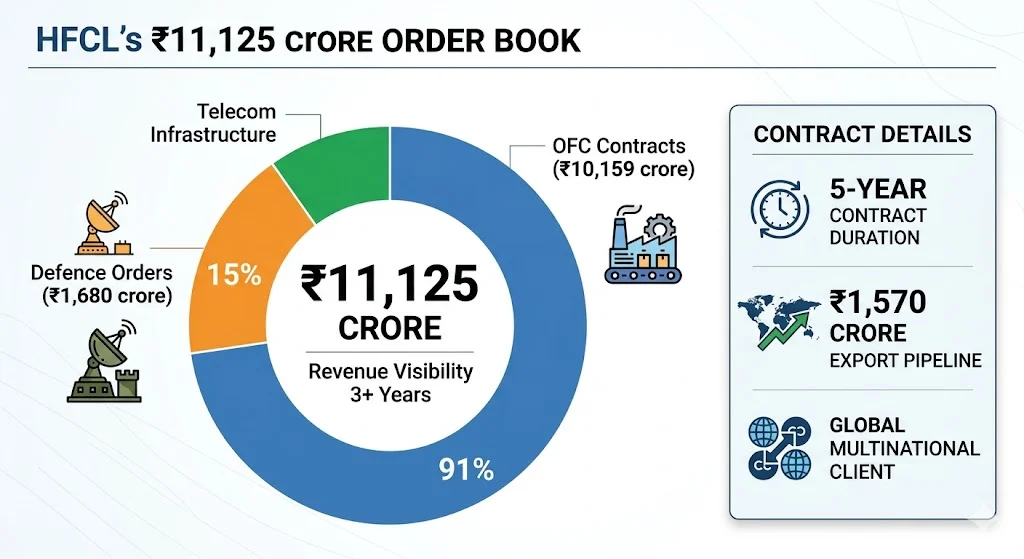
Landmark OFC Contract: In March 2026, HFCL secured a multi-year supply agreement worth approximately ₹10,159 crore (USD 1.1 billion) for high-fiber-count optical fiber cables to a global multinational client. This contract spans 2026 to 2030 with a two-year extension option and represents HFCL’s first long-term, high-volume OFC agreement. The contract provides revenue visibility for nearly five years and validates the company’s manufacturing capabilities on the global stage.
Defence Business Consolidation: The company unified its defence operations under a new subsidiary, HFCL Advance Systems Private Limited (HASPL). This subsidiary starts with a confirmed order book of ₹1,680 crore and an export pipeline of ₹1,570 crore in aerostructures, aeronautics, and defence manufacturing. The defence arm acquired Spiral EHL Engineering, took an 80% stake in Raddef (a radar technology company), and integrated the thermal weapon sight business. These acquisitions received ₹175 crore in investment and position HFCL to capture opportunities from India’s defence indigenization push.
Q3 FY26 Financial Recovery: The company reported consolidated revenue of ₹1,211 crore for Q3 FY26, marking 19.6% year-over-year growth. EBITDA grew 51.5% to ₹230 crore, while profit after tax surged 40.7% to ₹102 crore. These results demonstrate operational improvements driven by higher OFC volumes, better price realization, and cost optimization initiatives.
HFCL Share Price Target 2027: Scaling Operations and Margin Expansion
The year 2027 represents the scaling phase where HFCL’s investments in capacity and defence capabilities begin translating into sustained revenue and profit growth.
Monthly Share Price Targets for 2027
| Month | Minimum Price Target (₹) | Maximum Price Target (₹) | Expected Drivers |
|---|---|---|---|
| January 2027 | 200 | 220 | FY27 annual guidance, preform facility operational |
| February 2027 | 205 | 228 | Q3 FY27 results, export momentum continuation |
| March 2027 | 210 | 235 | FY27 close, order book updates for FY28 |
| April 2027 | 215 | 242 | Q4 FY27 earnings, defence contract execution |
| May 2027 | 220 | 250 | Capacity utilization improvements |
| June 2027 | 228 | 258 | H1 FY28 results, monsoon impact assessment |
| July 2027 | 235 | 265 | Data centre demand trends, AI infrastructure spending |
| August 2027 | 242 | 272 | Defence export order execution |
| September 2027 | 250 | 280 | Q2 FY28 results, festival season preparation |
| October 2027 | 258 | 288 | Global OFC market recovery confirmation |
| November 2027 | 265 | 295 | FY28 guidance, R&D pipeline updates |
| December 2027 | 270 | 300 | Year-end performance, 2028 outlook |
Description of the 2027 Price Target Table:
This table outlines HFCL’s expected price trajectory for 2027, building upon the operational foundations established in 2026. The minimum targets show progression from ₹200 to ₹270 (35% appreciation), while maximum targets expand from ₹220 to ₹300 (36% appreciation). The narrower percentage range compared to 2026 reflects greater execution certainty as major capacity expansions become operational.
The monthly progression assumes steady execution of the ₹10,159 crore OFC contract, successful integration of defence acquisitions, and gradual margin improvement from backward integration through the preform facility. The targets also factor in potential volatility from global optical fiber demand cycles and India’s monsoon season impact on infrastructure deployment.
Fundamental Catalysts for 2027
Backward Integration Benefits: The preform manufacturing facility approved in 2026 should reach full operational capacity by early 2027. This backward integration reduces raw material costs and improves gross margins by an estimated 200 to 300 basis points. The facility also insulates HFCL from global supply chain disruptions in optical fiber preforms.
Data Centre and AI Infrastructure Demand: India is experiencing explosive growth in data consumption and data centre investments. Hyperscalers are investing billions of dollars in Indian data centre infrastructure, creating sustained demand for high-capacity optical fiber cables. HFCL’s development of a 3456-fibre Micro Duct IBR cable (the highest fiber-count cable manufactured by the company to date) positions it to capture this premium segment demand.
Defence Revenue Contribution: The HFCL Advance Systems subsidiary should begin meaningful revenue contribution in 2027 as the ₹1,680 crore order book converts to sales. The ₹1,570 crore export pipeline in aerostructures and aeronautics provides additional upside potential. The 329-acre land allotment in Andhra Pradesh for defence manufacturing should progress toward facility construction.
Government Policy Support: The Draft National Telecom Policy 2025 aims for ₹1 trillion in telecom sector capital expenditure and 1 million jobs by 2030. The policy emphasizes local manufacturing, which benefits indigenous players like HFCL compared to global competitors. Implementation of TRAI mandates for minimum 25 Mbps data speeds and enhanced voice quality (effective January 2026) drives infrastructure upgrades requiring HFCL’s products.
HFCL Share Price Target 2028: Maturation and Market Leadership
By 2028, HFCL aims to establish itself as a leading integrated player in telecom infrastructure and defence electronics with significantly improved profitability metrics.
Monthly Share Price Targets for 2028
| Month | Minimum Price Target (₹) | Maximum Price Target (₹) | Strategic Milestones |
|---|---|---|---|
| January 2028 | 300 | 330 | FY28 guidance, defence facility operational |
| February 2028 | 308 | 340 | Q3 FY28 results, export order book expansion |
| March 2028 | 315 | 350 | FY28 close, 5-year OFC contract mid-point review |
| April 2028 | 325 | 360 | Q4 FY28 earnings, margin expansion confirmation |
| May 2028 | 335 | 370 | Market share gains in data centre segment |
| June 2028 | 345 | 380 | H1 FY29 results, capacity optimization |
| July 2028 | 355 | 390 | 5G and early 6G development participation |
| August 2028 | 365 | 400 | Defence export scaling |
| September 2028 | 375 | 410 | Q2 FY29 results, technology leadership |
| October 2028 | 385 | 420 | Global OFC market positioning |
| November 2028 | 395 | 430 | FY29 guidance, R&D commercialization |
| December 2028 | 420 | 460 | Year-end performance, 2029 strategic outlook |
Description of the 2028 Price Target Table:
The 2028 price target table reflects HFCL’s transition from expansion phase to operational excellence phase. The minimum targets advance from ₹300 to ₹420 (40% appreciation), while maximum targets progress from ₹330 to ₹460 (39% appreciation). The steeper absolute price levels reflect the company’s expected evolution into a larger, more profitable organization.
The progression assumes successful execution of the five-year OFC contract (reaching its midpoint in March 2028), operational defence manufacturing facilities, and established market leadership in high-capacity optical fiber cables for data centres. The targets also incorporate expectations of improved return ratios as the company leverages its installed capacity base.
Operational Milestones for 2028
Technology Leadership Position: By 2028, HFCL expects to consolidate its position as a technology leader in optical fiber cables and defence electronics. The company’s investments in R&D should yield commercial products for 5G and early 6G network requirements. The 3456-fiber cable technology positions HFCL at the premium end of the market where competition is less intense and margins are higher.
Margin Profile Improvement: With backward integration fully operational and defence electronics contributing higher-margin revenues, HFCL targets EBITDA margins of 22-25% by 2028 compared to approximately 20% in Q3 FY26. This margin expansion drives disproportionate profit growth relative to revenue growth.
Export Revenue Scaling: The company achieved 27% export contribution to total revenues in Q3 FY26 through USD 192 million in export orders. By 2028, HFCL targets export revenue contribution of 35-40% as global data centre investments continue and defence export contracts mature. Geographic diversification reduces dependence on Indian government capex cycles.
Defence Business Maturation: The HFCL Advance Systems subsidiary should achieve significant scale by 2028 with the Andhra Pradesh defence manufacturing facility fully operational. The combination of domestic defence orders and export contracts in aerostructures creates a sustainable, high-margin revenue stream.
HFCL Share Price Target 2030: Long-Term Vision and Value Creation
The year 2030 represents the culmination of HFCL’s current strategic initiatives, with the company positioned as a major telecom infrastructure and defence electronics player in India.
Long-Range Price Target Framework for 2030
| Month | Minimum Price Target (₹) | Maximum Price Target (₹) | Long-Term Drivers |
|---|---|---|---|
| January 2030 | 720 | 760 | FY30 guidance, 5-year OFC contract completion |
| February 2030 | 735 | 780 | Q3 FY30 results, next-generation product pipeline |
| March 2030 | 750 | 800 | FY30 close, strategic plan for next decade |
| April 2030 | 765 | 820 | Q4 FY30 earnings, dividend policy review |
| May 2030 | 780 | 840 | Market leadership consolidation |
| June 2030 | 800 | 860 | H1 FY31 results, 6G development participation |
| July 2030 | 820 | 880 | AI infrastructure market positioning |
| August 2030 | 840 | 900 | Defence export scaling to new markets |
| September 2030 | 860 | 920 | Q2 FY31 results, technology licensing revenue |
| October 2030 | 880 | 940 | Global expansion milestones |
| November 2030 | 920 | 980 | FY31 guidance, ESG leadership recognition |
| December 2030 | 1000 | 1070 | Year-end performance, 2031 strategic outlook |
Description of the 2030 Price Target Table:
The 2030 price target table represents long-term value creation potential based on successful execution of HFCL’s current strategic roadmap. The minimum targets show progression from ₹720 to ₹1000 (39% appreciation within the year), while maximum targets advance from ₹760 to ₹1070 (41% appreciation). The absolute price levels assume the company achieves significant scale with annual revenues approaching ₹10,000 crore.
The progression assumes completion of the landmark ₹10,159 crore OFC contract, established market position in defence electronics with both domestic and export revenues, and potential entry into adjacent markets such as data centre networking equipment. The targets also incorporate expectations of improved capital efficiency and potential dividend initiation as the company matures.
Strategic Vision for 2030
Revenue Scale Achievement: HFCL management has publicly stated their ambition to become a ₹10,000 crore revenue enterprise. By 2030, this target appears achievable through the combination of:
- Optical fiber cable revenues from the five-year contract and follow-on orders
- Defence electronics revenues from domestic and export contracts
- Potential entry into data centre networking equipment (a market expected to see $1.1 trillion in capital expenditure globally by FY29)
Profitability Transformation: The company expects to transition from volatile profitability patterns to consistent, high-quality earnings. By 2030, HFCL targets:
- EBITDA margins of 25% or higher through product mix improvement
- Return on equity of 15-20% through better capital utilization
- Debt reduction to minimal levels as expansion capex concludes
Technology and Innovation Leadership: HFCL’s R&D investments should yield a portfolio of proprietary technologies by 2030, potentially including:
- Advanced optical fiber cables for 6G networks
- Indigenous defence electronics systems with export potential
- Data centre networking solutions leveraging AI and machine learning
ESG and Sustainability Focus: By 2030, HFCL expects to establish leadership in sustainable manufacturing practices for telecom infrastructure, aligning with global hyperscaler requirements for green supply chains.
Can HFCL Be a Multibagger? Detailed Analysis
The question of multibagger potential requires examination of HFCL’s historical performance, current valuation, and future growth catalysts.
Historical Multibagger Performance
HFCL has already demonstrated multibagger characteristics over the past five years. The stock delivered returns of 465% over the five-year period ending early 2026, transforming from a penny stock trading around ₹10 in April 2020 to current levels near ₹68-70. Even after a 40% decline in calendar year 2025 (the worst annual drop since 2008), the stock maintains 162% returns over five years and 395% returns over six years.
The stock reached an all-time high of ₹171 in September 2024, representing a 17x return from its 2020 lows. This historical performance demonstrates HFCL’s capacity to deliver multibagger returns during favorable market conditions and execution phases.
Future Multibagger Potential Assessment
Bull Case for Multibagger Returns:
- Strong Order Book Visibility: The ₹11,125 crore order book as of December 2025 provides revenue visibility for nearly three years at current run rates. The ₹10,159 crore five-year OFC contract alone represents transformational revenue potential.
- Defence Business Optionality: The creation of HFCL Advance Systems with ₹1,680 crore initial order book and ₹1,570 crore export pipeline opens a entirely new growth vertical with higher margins and longer contract durations.
- Data Centre and AI Tailwinds: Global hyperscalers are investing billions in Indian data centre infrastructure. HFCL’s positioning as a domestic manufacturer of high-capacity optical fiber cables aligns perfectly with this trend.
- Backward Integration Margin Expansion: The preform manufacturing facility should improve gross margins by 200-300 basis points, creating operating leverage that amplifies profit growth relative to revenue growth.
- Export Revenue Diversification: The 27% export contribution in Q3 FY26 reduces dependence on domestic government capex cycles and exposes HFCL to global growth trends.
- Government Policy Support: India’s focus on Atmanirbhar Bharat in telecom and defence creates preferential market access for domestic manufacturers like HFCL.
Bear Case Against Multibagger Returns:
- Valuation Concerns: HFCL trades at a price-to-earnings ratio of approximately 165-365x depending on calculation methodology, significantly above the sector average of 16x. This elevated valuation leaves limited room for multiple expansion.
- Execution Risk: The company has a history of volatile profitability, with Q4 FY25 showing a net loss of ₹81.4 crore due to execution challenges and margin pressures.
- Promoter Dilution: Promoter holding declined from 35.89% to 28.29% over four quarters, raising concerns about long-term commitment. Mutual fund holdings fell 5.18 percentage points in a single quarter.
- Competition Intensity: Global players are increasingly targeting the Indian market, while domestic competitors like Sterlite Technologies and Tejas Networks are also expanding capacity.
- Working Capital Intensity: The transition from project-led to product-led revenue requires significant working capital investment, potentially straining cash flows.
- Technology Obsolescence Risk: Rapid evolution in telecom technology (5G to 6G transition) requires continuous R&D investment to maintain relevance.
Multibagger Probability Assessment
Based on the analysis, HFCL retains multibagger potential but with higher risk than traditional multibagger candidates. The probability of 3-5x returns from current levels over the next 5-7 years appears moderate (40-50% probability) contingent on:
- Successful execution of the ₹10,159 crore OFC contract without margin erosion
- Defence business scaling to ₹2,000+ crore annual revenue run rate by 2028
- Achievement of 25%+ EBITDA margins through product mix improvement
- Maintenance of export revenue momentum at 30%+ of total sales
The path to multibagger returns requires patience through near-term volatility and confidence in management’s execution capabilities.
Is HFCL a Good Company to Invest In? Fundamental Analysis
Evaluating HFCL as an investment requires systematic analysis of financial metrics, management quality, competitive positioning, and risk factors.
Financial Performance Analysis
Revenue Growth Trajectory:
HFCL reported consolidated revenue of ₹1,210.79 crore in Q3 FY26, representing 19.65% year-over-year growth from ₹1,011.95 crore in Q3 FY25. This growth reverses the declining trend seen in earlier quarters of FY25 and demonstrates the company’s ability to capture demand recovery in the optical fiber cable market.
The nine-month FY26 revenue trend shows sequential improvement:
- Q1 FY26: ₹871 crore
- Q2 FY26: ₹1,043 crore
- Q3 FY26: ₹1,211 crore
This progression indicates accelerating momentum as capacity expansions come online and export orders materialize.
Profitability Metrics:
| Metric | Q3 FY26 | Q3 FY25 | Change | Assessment |
|---|---|---|---|---|
| EBITDA (₹ crore) | 243.52 | 171.90 | +41.67% | Strong improvement |
| EBITDA Margin | 20.11% | 16.99% | +312 bps | Healthy expansion |
| PAT (₹ crore) | 102.37 | 72.58 | +41.04% | Robust profit growth |
| PAT Margin | 8.45% | 7.17% | +128 bps | Improving profitability |
| EPS (Diluted) (₹) | 0.67 | – | – | Earnings per share |
Description of the Profitability Metrics Table:
This table presents HFCL’s key profitability metrics comparing Q3 FY26 performance against the same quarter in the previous year. The data reveals significant operational improvements across all major metrics. EBITDA grew 41.67% year-over-year, outpacing revenue growth and demonstrating operating leverage. The 312 basis point expansion in EBITDA margin indicates successful cost optimization and product mix improvement.
Profit after tax growth of 41.04% shows that margin improvements are flowing through to bottom-line earnings rather than being offset by interest or depreciation costs. The 128 basis point improvement in PAT margin suggests sustainable profitability enhancement rather than one-time gains.
Balance Sheet Strength:
| Metric | Value | Assessment |
|---|---|---|
| Debt-to-Equity Ratio | 0.29-0.32 | Conservative leverage |
| Total Debt | ₹1,259 crore | Manageable for company size |
| Promoter Pledging | 1.15% | Low risk level |
| Current Ratio | 1.87 | Adequate liquidity |
| Book Value per Share | ₹27-30 | Asset backing present |
The debt-to-equity ratio of 0.29-0.32 ranks among the lowest in the peer group, indicating conservative financial management. However, total debt of ₹1,259 crore requires monitoring as the company executes its ₹800-900 crore capex plans.
Promoter pledging at 1.15% of holdings represents a significant improvement from historical levels where concerns existed about high promoter pledging. The current level indicates low financial risk from promoter leverage.
Management Quality Assessment
Promoter and Leadership Team:
Mahendra Nahata serves as Promoter and Managing Director, providing continuity in strategic direction. The management team demonstrates several positive characteristics:
- Strategic Vision: The creation of HFCL Advance Systems and pursuit of backward integration through the preform facility show long-term thinking beyond short-term quarterly results.
- Execution Focus: Management commentary in Q3 FY26 emphasized “focused execution” and “improving the quality and sustainability of our revenue mix,” indicating awareness of past execution challenges.
- Capital Allocation Discipline: The decision to fund capex through promoter equity rather than excessive debt demonstrates prudent capital allocation.
- Transparency: Regular investor communications and detailed earnings presentations provide visibility into operational progress.
Areas of Concern:
- Promoter Stake Reduction: The decline in promoter holding from 35.89% to 28.29% over four quarters raises questions about long-term commitment, though the level remains above the critical 25% threshold.
- Fund Raising Frequency: Multiple equity raises and warrant issuances have created dilution concerns among investors, contributing to the stock’s underperformance in 2025.
- Profitability Volatility: The Q4 FY25 loss of ₹81.4 crore and historical earnings volatility indicate execution challenges that management must address consistently.
Competitive Positioning
Market Position in Optical Fiber Cables:
HFCL ranks among the top three domestic manufacturers of optical fiber cables in India, competing primarily with Sterlite Technologies and a few smaller players. The company’s competitive advantages include:
- Manufacturing Scale: With OFC capacity expanding to 42.36 million fiber kilometers by June 2026, HFCL achieves economies of scale that reduce per-unit costs.
- Product Innovation: The development of 3456-fiber cables positions HFCL at the premium end of the market for data centre applications.
- Domestic Manufacturing: As a fully domestic manufacturer, HFCL benefits from government preferences for local sourcing under the Atmanirbhar Bharat initiative.
- Integrated Operations: Backward integration into preform manufacturing (once operational) provides cost advantages and supply security.
Competitive Challenges:
- Global Competition: International players like Corning and Prysmian possess superior technology and financial resources for R&D investments.
- Price Competition: The OFC market experiences periodic overcapacity leading to price wars and margin compression.
- Customer Concentration: Dependence on large telecom operators and government projects creates customer concentration risk.
Risk Factors
Operational Risks:
- Execution Risk: Large capex projects (preform facility, capacity expansion) face execution risks including cost overruns and delays.
- Working Capital Intensity: The transition to product-led revenue requires inventory investment and receivables financing, straining cash flows.
- Technology Obsolescence: Rapid evolution in telecom technology requires continuous R&D to maintain relevance.
Financial Risks:
- Valuation Risk: Current P/E ratios of 165-365x assume significant future growth; any execution shortfall could trigger sharp multiple compression.
- Interest Rate Sensitivity: Rising interest expenses (up 25.63% year-over-year in nine-month FY26) impact profitability.
- Currency Risk: Export revenues expose HFCL to rupee-dollar exchange rate volatility.
Market Risks:
- Capex Cyclicality: Telecom operator capex follows multi-year cycles; downturns impact HFCL’s order inflows.
- Government Policy Changes: Changes in procurement policies or Atmanirbhar Bharat emphasis could impact demand.
- Small Cap Volatility: As a mid-cap stock, HFCL experiences higher volatility than large-cap peers.
Investment Recommendation: Should You Buy HFCL Shares?
Suitable Investor Profiles
HFCL shares are appropriate for the following investor categories:
Growth-Oriented Long-Term Investors: Investors with 5-7 year horizons who can tolerate volatility and believe in India’s digital infrastructure and defence indigenization themes.
Sector-Specialist Investors: Those with specific conviction about the optical fiber cable and defence electronics sectors who understand the cyclical nature of these industries.
Risk-Tolerant Investors: Investors comfortable with small-cap volatility and execution risks who seek multibagger potential.
Investment Sizing and Portfolio Allocation
Given the risk profile, HFCL should represent:
- Maximum 3-5% of a diversified equity portfolio for aggressive investors
- Maximum 1-2% for moderate risk investors
- Avoid or minimal allocation for conservative investors
Entry Strategy Considerations
Favorable Entry Points:
- Current levels near ₹68-70 offer reasonable risk-reward given the ₹11,125 crore order book
- Any dips toward the 52-week low of ₹59.82 provide better entry points
- Post-Q4 FY26 results (expected May 2026) if results confirm Q3 momentum
Caution Signals:
- Avoid entry if valuation metrics exceed P/E of 200x on forward earnings
- Monitor promoter pledge levels; any increase above 5% signals concern
- Watch for mutual fund holding trends; continued selling indicates institutional skepticism
Exit Triggers
Consider reducing or exiting positions if:
- Promoter holding falls below 25%
- Defence business fails to scale beyond ₹500 crore annual revenue by 2027
- EBITDA margins contract below 15% for two consecutive quarters
- Export revenue contribution falls below 20%
- Debt-to-equity ratio exceeds 0.50
Conclusion: HFCL Share Price Targets & Investment
HFCL Limited presents a compelling but complex investment opportunity at current valuations. The company operates in structurally growing sectors (telecom infrastructure, defence electronics) with strong policy tailwinds from India’s digital transformation and Atmanirbhar Bharat initiatives. The ₹11,125 crore order book, landmark ₹10,159 crore OFC contract, and defence subsidiary creation provide tangible evidence of growth potential.
However, the investment case requires balancing significant opportunities against material risks. The elevated valuation (P/E of 165-365x), historical profitability volatility, promoter stake reduction, and execution challenges on large capex projects create uncertainty. The stock’s 40% decline in 2025 demonstrates the volatility inherent in this investment.
Summary Price Targets:
| Year | Minimum Target | Maximum Target | Key Assumptions |
|---|---|---|---|
| 2026 | ₹131-195 | ₹140-220 | Capacity expansion execution, Q4 FY26 results |
| 2027 | ₹200-270 | ₹220-300 | Backward integration benefits, defence scaling |
| 2028 | ₹300-420 | ₹330-460 | Operational excellence, margin expansion |
| 2030 | ₹720-1000 | ₹760-1070 | Long-term contract completion, market leadership |
Final Words:
HFCL can potentially deliver multibagger returns for patient investors who believe in management’s execution capabilities and India’s infrastructure growth story. However, the path will likely feature significant volatility requiring strong conviction and appropriate position sizing. The stock is suitable for growth-oriented investors with 5-7 year horizons and tolerance for small-cap risks, but requires careful monitoring of execution milestones and valuation metrics.
Related Posts :


Share This Post